TABLEAU REPRESENTATION
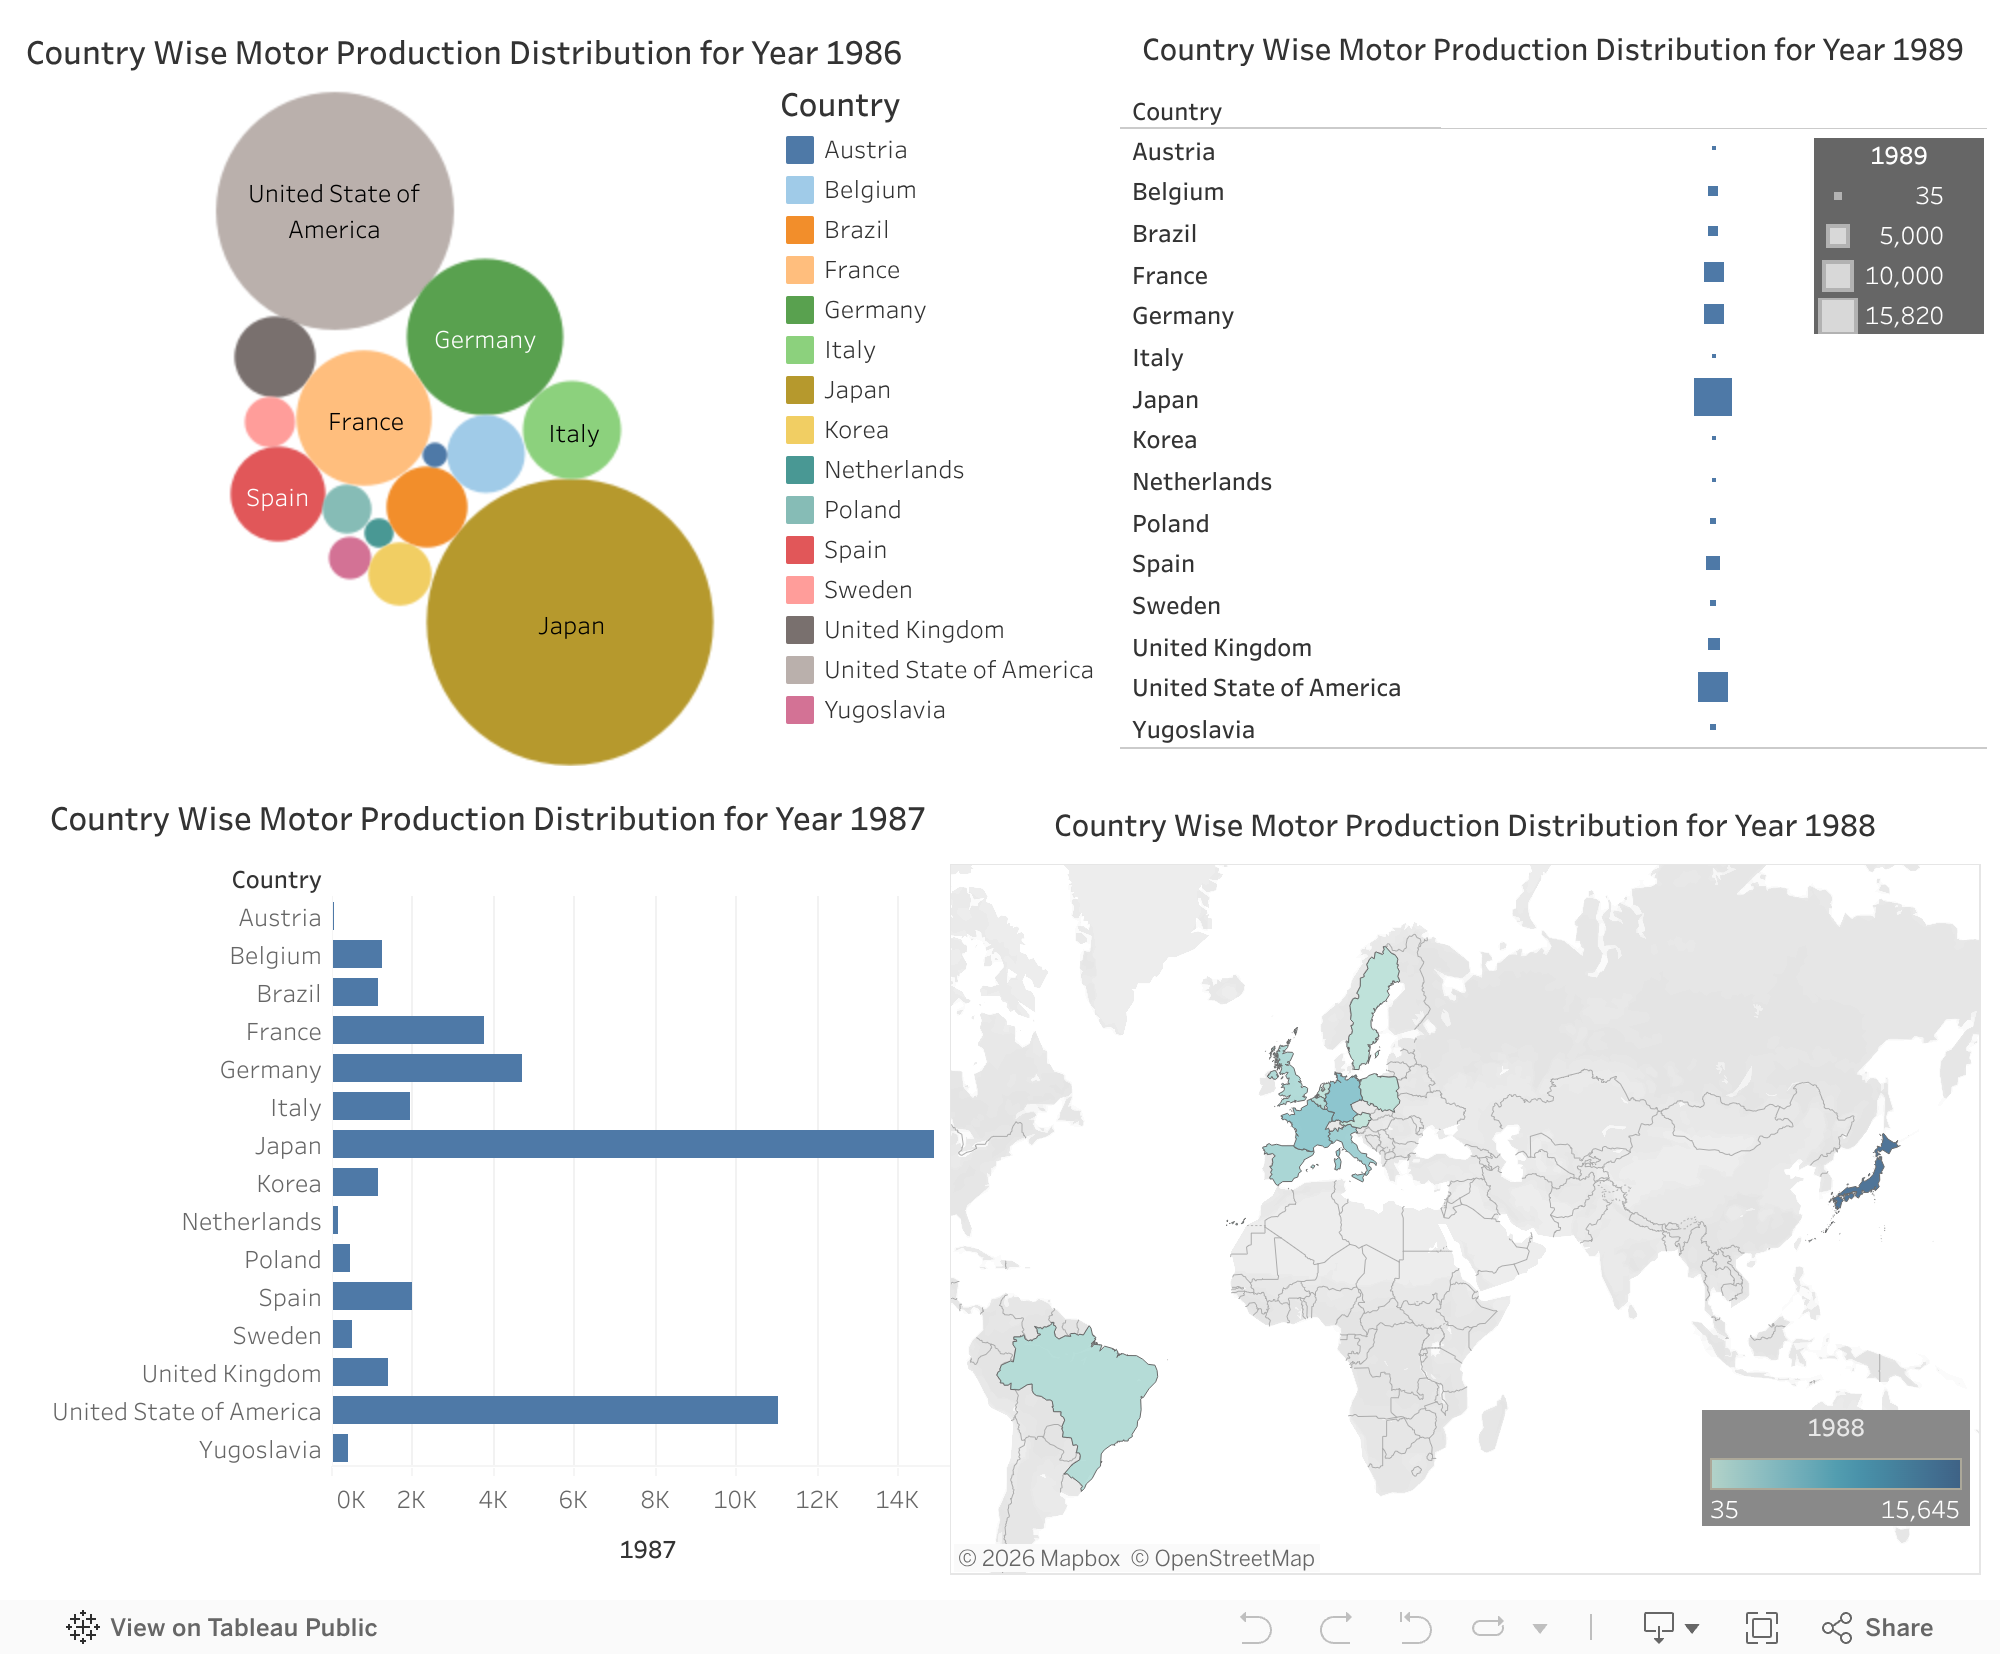
The data represents Motor Productions of 15 countries from
1986-1989 as calculated on 31st December of that year.
Done under guidance of Dr. Parthiban Sir for
Information Visualisation - 18CSE301J
Motor production, or the manufacturing of motors, can be influenced by several factors. Here are some key aspects that can impact motor production:
My visualization project aims to analyze the motor production of vehicles specifically from the years 1986 to 1989. By delving into this specific time frame, we can gain valuable insights into the trends, advancements, and challenges faced by the automotive industry during that period.
Using historical data and statistical analysis, my visualization will showcase various key metrics related to motor production, such as the total number of vehicles produced, the types of motors utilized, and the distribution of motor types across different vehicle categories.
By examining the motor production of vehicles from 1986 to 1989, my visualization aims to uncover valuable insights. These insights can help researchers, automotive enthusiasts, and industry professionals better understand the historical context, technological advancements, and production strategies employed during this specific period. Ultimately, the visualization seeks to provide a comprehensive and engaging analysis of motor production in the automotive sector during the late 1980s.